Customer Missed
Opportunity Insight display
Procedures for using the Missed Opportunities Analysis display.
Menu option 7305.
The Customer Missed Opportunity
display is used to identify potential sales opportunities that can be taken
advantage of.
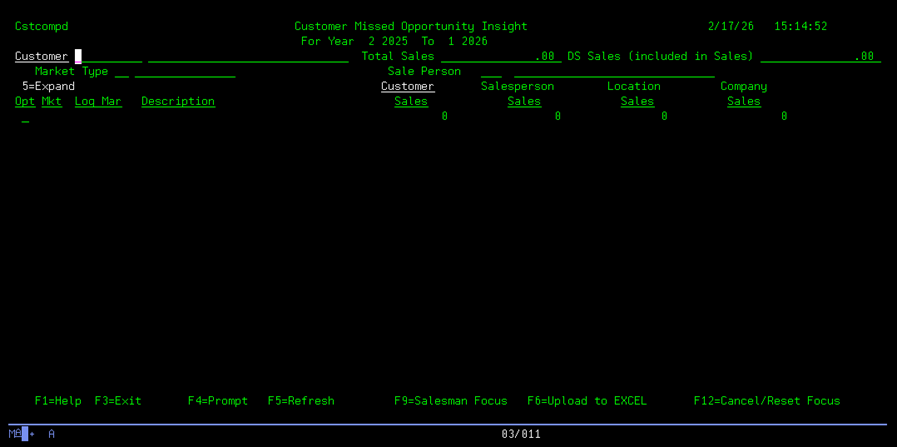
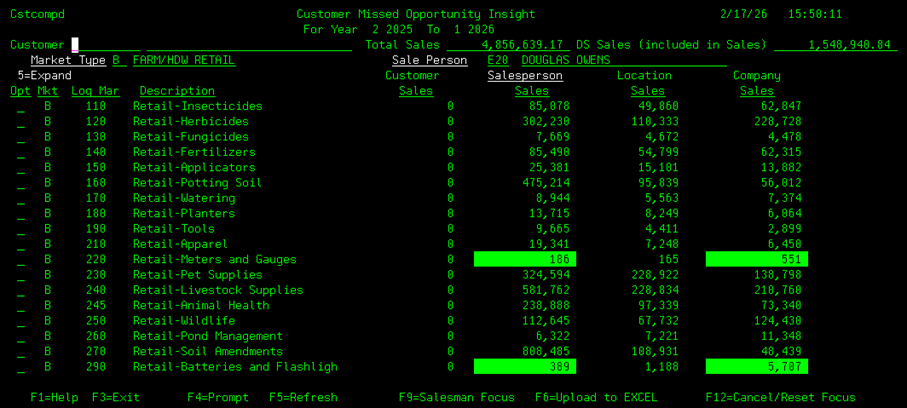
When the initial screen is displayed,
enter a customer that you wish to review.
![]()
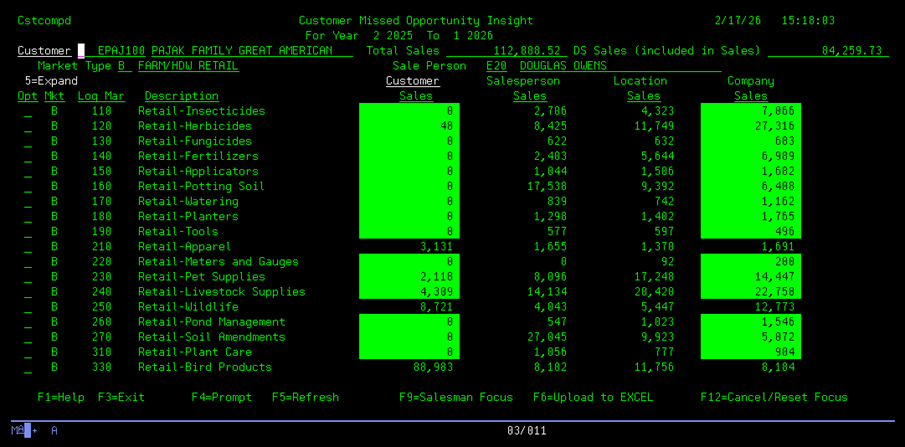
The customer will display with their sales by Logmar for their default Market Type for any Logmar that this customer has purchased in the last 12 months.
NOTE: The formulas for how the sales figures are calculated are explained below.
![]()
![]()
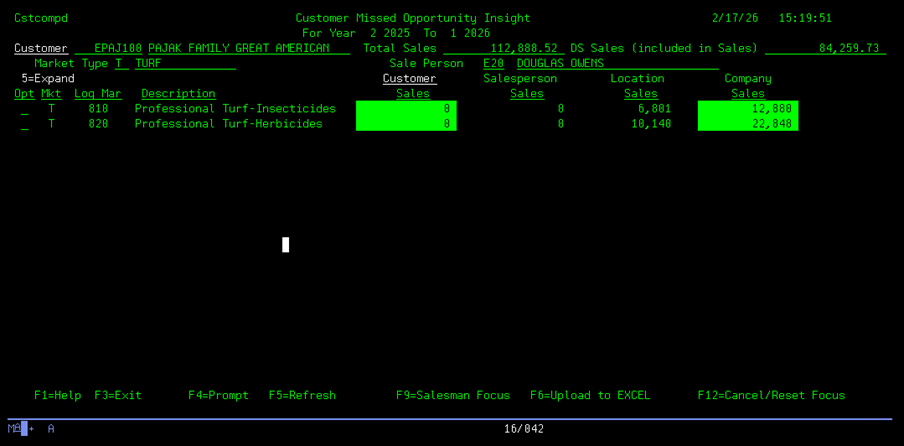
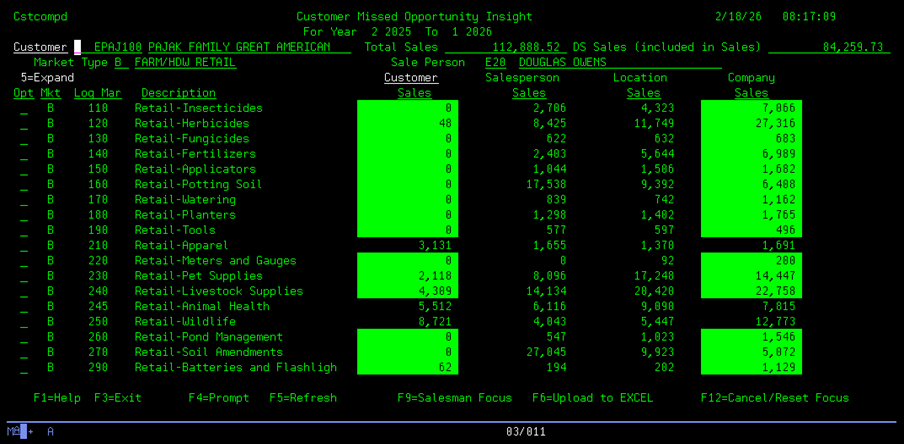
To display the sales for a different
Market Type, key the new Market Type over the display type and press
ENTER. The display will show any Logmars bought by this customer under this Market Type.
![]()
![]()
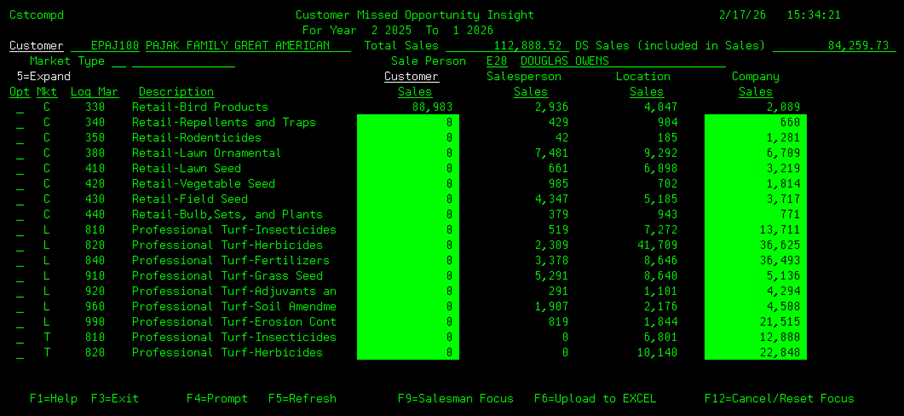
You can display ALL Market
Types purchased by this customer by blanking the Market Type field.
![]()
![]()
The initial display is focused on the
sales for the customer displayed. Function key F9 will change the focus to the
displayed salesperson. This is the
display after pressing F9:
![]()
Function key usage:
![]()

The following function keys are
available:
F1 – Displays the Help screens in your Chrome web browser.
F3 – Exits the Missed Opportunity program and returns to the main menu.
F4 – If the desired Customer, Market Type, or Salesperson code is not known, they can be searched by placing the cursor on the required entry field and pressing F4.
The appropriate lookup screen will display to select the wanted information.
F5 – F5 reloads the data display in case any changes to the sales data has been updated.
F6 – Creates an Excel file of the display data and Emails the file to your inbox.
F9 – Switches between the Customer Focus and the Salesperson Focus.
F12 – Clears the requested data and sales information to begin a new customer inquiry.
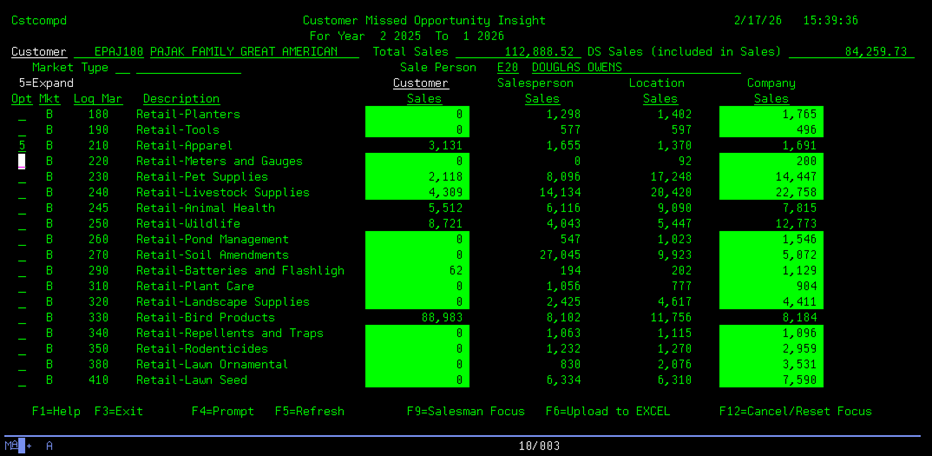
You can then display the detail of Logmar codes that make
up the displayed 3-digit Logmar by using Option 5. Enter a 5 on the row of the Logmar to expand and press ENTER.
![]()
![]()
![]()
This is
the expanded display for Market Type B, Logmar 210:
![]()
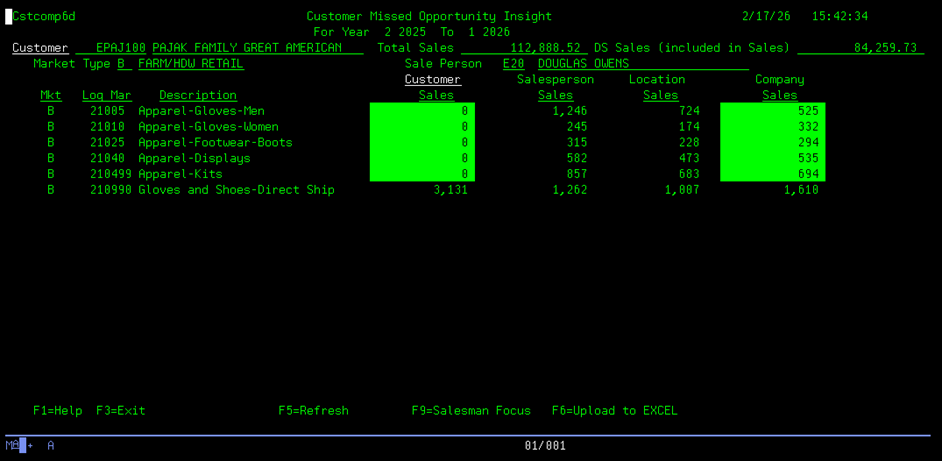
When
ready, press F3 to return to the primary 3-digit Logmar
screen.
Calculations used to create Missed Opportunities Analysis
display.
All sales numbers are pulled from the Logmar sales history file, LOGMSLS.
LOGMSLS is categorized by each item’s Logmar code, Warehouse number, Customer Code, Sales Type, and Pricing Type;
with 1 record per year with buckets for each month’s sales amount.
LOGMSLS is updated whenever a customer invoice is processed.
The sales months are summarized in the Missed Opportunities display, based on the months/years selected.
Customer focus:
Sales
numbers are based on the requested customer.
![]()
![]()
![]()
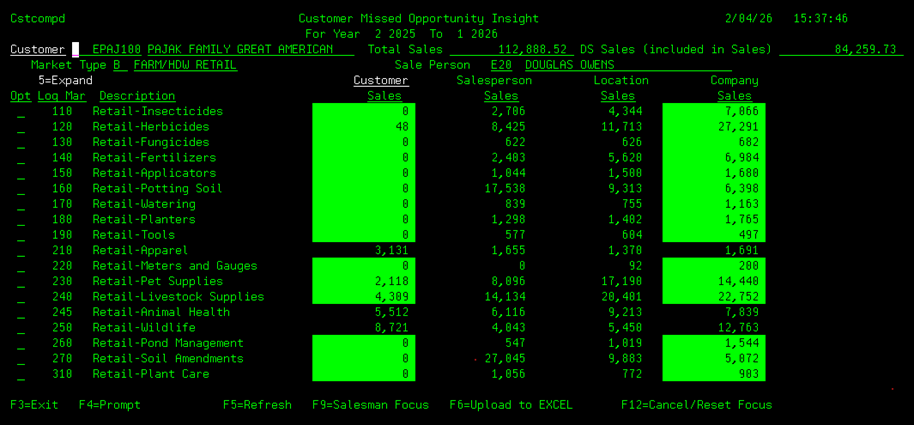
Column A Column B Column C Column D
Header A – Total Sales.
Total sales for the displayed customer for the period displayed. (Sales amount includes Direct Ship sales).
Program – BLDCST12MO/GETSHP12MO.
Header B – DS Sales.
Total Direct Ship sales for the displayed customer for the period displayed.
Program – BLDCST12MO/GETSHP12MO.
NOTE: Columns A thru D are calculated using sales numbers from the company’s larger customers.
The minimum customer sales (for the last 12 months) for inclusion in the calculations are based on Market Types.
Type A – Minimum Amount $50,000.
B - $50,000.
C - $25,000.
F - $50,000.
L - $25,000.
P - $15,000.
T - $25,000.
Column A – Customer Sales.
Total sales for the displayed customer/Logmar codes (summarized by the Logmar’s 3-digit category).
Program – GETSLG12MO.
Column B – Salesperson Sales.
Average sales for the displayed salesman/Logmar codes (summarized by the Logmar’s 3-digit category).
The Sales amount display is average sales amount sold per customer. (The total sales for the Logmar code divided by the number of customers that have bought this
Logmar.)
Program – GETSLG12MO.
Column C – Location Sales.
Average sales for the displayed branch/Logmar codes/Market Type (summarized by the Logmar’s 3-digit category).
The Sales amount displayed is the average
sales amount sold per customer for the Salesman’s branch. (The total sales for the Logmar
code divided by the number of
customers that have bought this Logmar.)
Program – BLDLG12MOB.
Column D – Company Sales.
Average sales for the displayed Logmar codes/Market Type (summarized by the Logmar’s 3-digit category).
The Sales amount
displayed is the average sales amount sold per customer for the entire
company. (The total sales for the Logmar code divided by the number of
customers that have bought this Logmar.)
Program – BLDLG12MOX.
Reverse image –
If the Customer Sales and Company Sales amount is displayed in reverse image when:
1) The Customer Sales amount is $0 and the Company Sales amount is not $0, or
2) The Customer Sales amount / Company Sales amount is less than 50%.
Salesperson focus:
![]()
![]()
![]() Sales numbers
are based on the requested salesperson.
Sales numbers
are based on the requested salesperson. 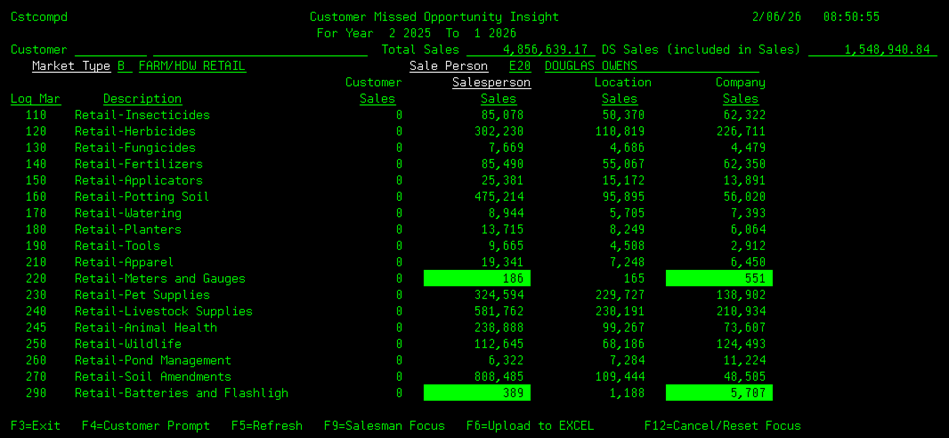
Column A Column B Column C Column D
Header A – Total Sales.
Total sales for the displayed salesperson for the period displayed. (Sales amount includes Direct Ship sales).
Program – BLDCST12MO/GETSHP12MO.
Header B – DS Sales.
Total Direct Ship sales for the displayed salesperson for the period displayed.
Program – BLDCST12MO/GETSHP12MO.
NOTE: Columns A thru D are calculated using sales numbers from the company’s larger customers.
The minimum customer sales (for the last 12 months) for inclusion in the calculations are based on Market Types.
Type A – Minimum Amount $50,000.
B - $50,000.
C - $25,000.
F - $50,000.
L - $25,000.
P - $15,000.
T - $25,000.
Column A – Customer Sales.
Not used on Salesperson focus.
Column B – Salesperson Sales.
Total sales for the displayed salesperson/Logmar codes/Market Type (summarized by the Logmar’s 3-digit category).
Program – GETSLG12MO.
Column C – Location Sales.
Average sales amount for the displayed salesperson’s branch/Logmar codes/Market Type (summarized by the Logmar’s 3-digit
category). (The total sales for the Logmar code for this branch divided by the number of salespersons that have sold this Logmar for this branch).
Program – BLDLG12MOB.
Column D – Company Sales.
Average sales for the entire company for the displayed Logmar code/Market Type (summarized by the Logmar’s 3-digit category).
The Sales amount displayed is the average sales amount
sold per salesperson for the entire company.
(The total sales for the Logmar code divided
by the number of
salespersons that have sold this Logmar).
Program – BLDLG12MOX.
Reverse image –
If the Salesperson Sales and Company Sales amount is displayed in reverse image when:
1) The Salesperson Sales amount is $0 and the Company Sales amount is not $0, or
2) The Salesperson Sales amount / Company Sales amount is less than 50%.